
Introduction
The way customer data systems are built is undergoing a remarkable transformation. Across the industry, significant milestones have been reached - unified Customer 360 views, sophisticated machine learning (ML) models, and real-time streaming pipelines. These foundations set up the next leap: systems that don’t just analyze customer behavior, but actively shape experiences in real time.
The Teradata Customer Intelligence Framework represents this next generation of customer intelligence architecture. Built on established data engineering and machine learning practices, it enables autonomous, real-time decision-making. The framework equips data scientists, data engineers, ML engineers, and platform architects to create systems that sense needs, understand context, and take immediate action; powered by AI for CX that delivers measurable business impact.
The challenge
Modern customer data architectures hit the same three walls repeatedly. Data lives in disconnected systems, making a reliable Customer 360 fragile at best. Batch-heavy pipelines introduce latency, so insights arrive after the moment has passed. And unresolved customer tasks often escalate to costly channels, driving up operations while eroding satisfaction.
Fragmented data
Disconnected data across channels and life stages prevents a unified view of the customers, limiting actionable insights.
Friction drives up costs
Unresolved customer tasks escalate to expensive channels like call centers, increasing operational costs and harming satisfaction.
Inability to act in real time
It's not just about understanding customers—it's about moving with them. So static analytics will not cut it.
The Customer Intelligence Framework addresses these limits with an event-driven approach: unify raw streams into reusable data products, detect signals that carry business meaning in real time, and trigger guard-railed agent decisions that act immediately. In short, move from fragmented data and delayed reports to a closed loop that senses, decides, and acts.
Architecture: from data to intelligence
The Customer Intelligence Framework transforms raw data into autonomous intelligence through three core components working across five integrated layers:
Foundational Elements
Data products
Reusable, structured assets that organize complex customer data.
Signals
Actionable patterns in data that reflect customer behavior, intent, or opportunity.
Agents
Intelligent software entities that autonomously execute and adapt decisions.
- Data products - Reusable, structured assets that organize complex customer data. These multi-dimensional building blocks can be assembled differently for various use cases, with full version control and API accessibility via REST, Python SDKs, or SQL.
- Signals - Real-time patterns detected from customer behavior, not just transactions. The framework continuously identifies meaningful events like engagement drops, anomalous patterns, or service escalations, enabling immediate response rather than batch processing.
- Agents - Intelligent entities that autonomously execute decisions within configured guardrails. These agents operate across the end-to-end framework - from data orchestration and feature engineering to signal detection and service activation. They provide natural language interfaces, coordinate with other agents, and maintain full audit trails of their reasoning and actions.
Architecture Components
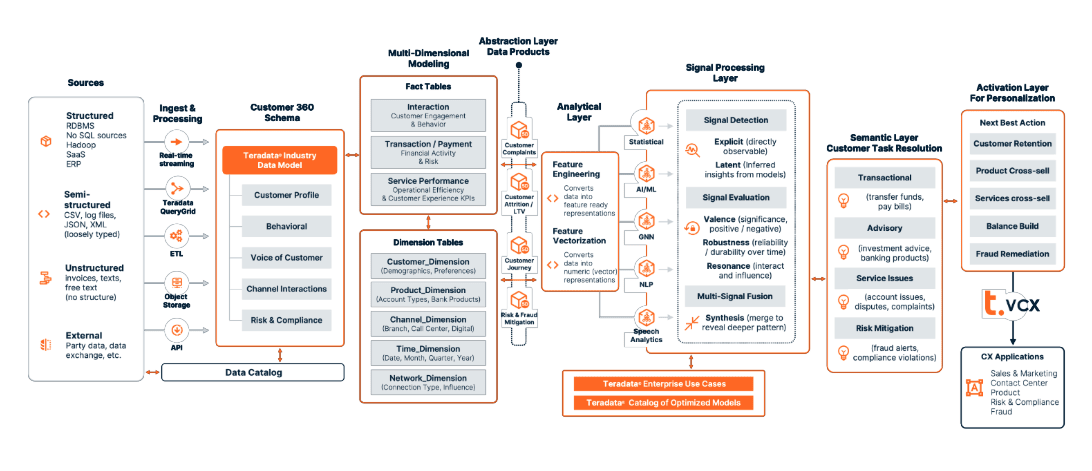
Customer Intellegence Framework Diagram
- Data ingestion. Structured, semi-structured, and unstructured sources land through streaming, ETL, object storage, and APIs; catalogued for lineage.
- Feature engineering (in-database). Transform inputs into robust features and vector representations close to the data to minimize movement.
- Models and rules. Hybrid decisioning blends ML models, heuristics, and policy rules to balance accuracy, cost, and control.
- Signal processing. Detect, evaluate, and fuse patterns; a semantic layer maps technical signals (scores, thresholds, sequences) to business concepts (intent, risk, opportunity).
- Service activation (VCX). Publish decisions and signals via pub/sub so downstream applications subscribe to just-in-time intelligence (NBA/NBO, retention, remediation). Outcomes flow back for continuous learning.
The architecture flows from data ingestion (supporting structured, semi-structured, and unstructured sources) through features engineering and model deployment using ClearScape Analytics® for in-database execution.
Signal processing interprets these patterns through a semantic layer that maps technical signals to business concepts, while the service activation layer, powered by Teradata VCX, streams real-time intelligence to downstream applications via publish/subscribe patterns.
Key technical advantages:
- Industry Data Models provide pre-built schemas for rapid deployment
- In-database processing eliminates data movement overhead
- Multi-model orchestration combines rules, ML models, and heuristics
- Every application can subscribe to relevant signals via REST APIs
Customer lifetime value multi-agent system demo
This demo shows how autonomous customer intelligence turns CLV forecasting and growth into a production workflow. The multi-agent system runs in Teradata AgentBuilder, keeps computation inside Teradata Vantage, and analyzes historical behavior directly in-database. LLMs - GPT-4.1 (routing/response) and Claude Sonnet-4 (analysis/strategy), drive intent understanding, exploration, and decisioning, combining reasoning with real-time signals to answer questions like “Which customer type has the highest CLV and why?” and to recommend next-best actions that lift retention and cross-sell.
The implementation uses Flowise inside AgentBuilder for low-code composition; the pattern is integration-friendly and supports additional connectors.
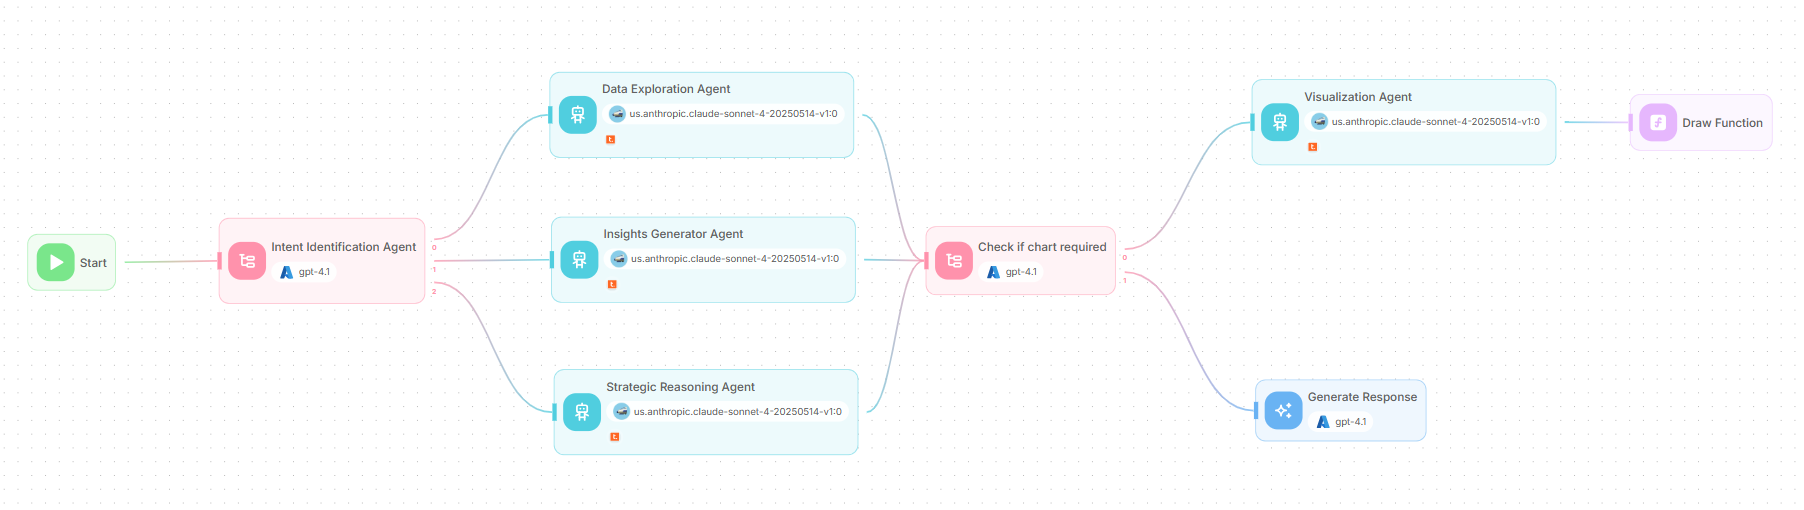
Architecture of the Customer Lifetime Value multi-agent system
In the multi-agent system architecture, a request enters at “Start”, the conditional agent classifies intent, and exactly one specialist is selected - data exploration, insights generator, or strategic reasoning. The “check if chart required” gate then decides whether a visual adds clarity. If a chart is warranted, the “Visualization Agent” prepares a spec and a custom JavaScript function renders the graphic using Teradata plotting; otherwise, the LLM node composes a concise text response. The result is a governed path from question to decision, with visuals used only when they improve understanding.
The multi-agent system includes the following nodes:
- Start node: Initializes the run by capturing the user’s input and shared context (customer/segment, time window, policy flags) for downstream nodes.
- Condition agent nodes: Route the flow based on intent (exploration/insights/strategy) and presentation needs (whether a chart is required).
- Agent nodes: Execute scoped tasks - data exploration, insight generation, strategic reasoning, and visualization using Teradata MCP tools against Vantage with clear guardrails.
- LLM node: Composes the final, business-ready response by fusing agent outputs, rationale, KPIs, and (if present) a chart caption.
- Custom function node: Renders artifacts like charts from a validated spec and returns an embeddable image/URI for the response.
Let’s look at the flow of the whole system!
Start node
The start node initializes the flow, captures the user’s input (chat or form) and sets shared variables - question, optional customer/segment, time window, table handles, and policy flags, for all downstream nodes.
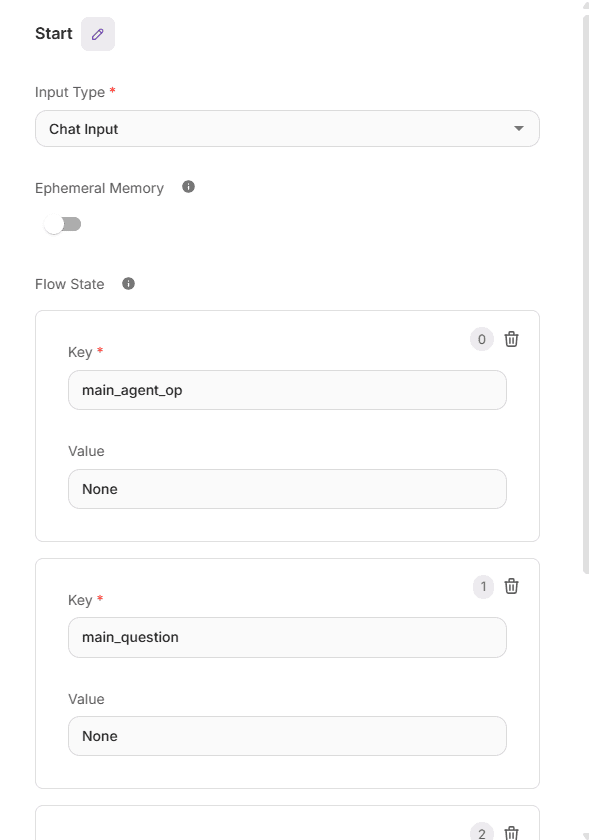
Start Node configuration
Condition agent node: intent identification agent
The Intent Identification Agent is the first of the two condition-agent nodes in the system. It decides which agent to call from the three available specialists, based on the scenario expressed in the user’s query.
There are three scenarios:
- User is asking for basic details about tables, databases, columns, etc.
- Routes to Data Exploration Agent
- User is asking about banking churn, customer lifetime value, CLV, correlation, sentiments analysis, charts like pie chart, histogram etc.
- Routes to Insights Generator Agent
- User is asking about recommendation to reduce the churn, what are the main factors leading to a churn or low CLV, recommend me method to reduce churn, which are the important factor for churn.
- Routes to Strategic Reasoning Agent
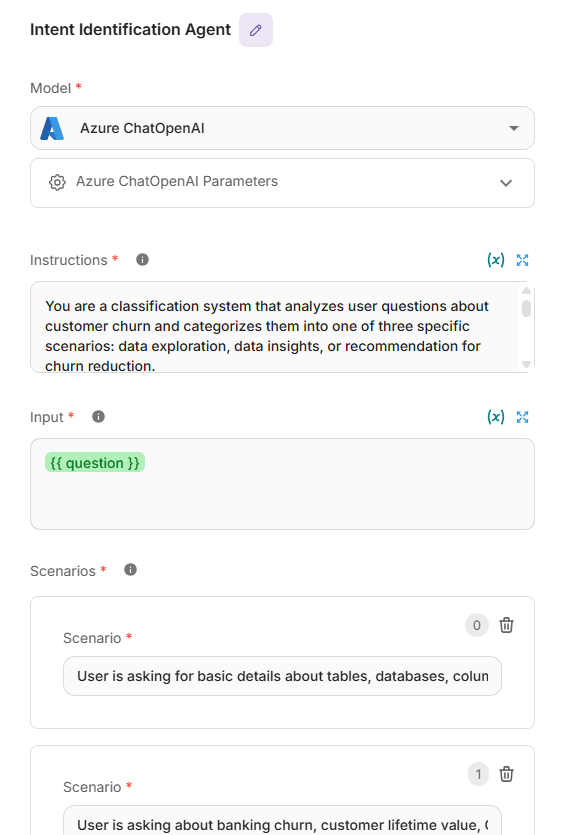
Intent Identification Agent node configuration
Based on the prompt instructions, an LLM such as Azure ChatOpenAI (GPT-4.1) interprets the intent, selects the appropriate scenario, and triggers the corresponding agent node. The model can be chosen per task; in this agent node, GPT-4.1 is used and configured with an API key (plus endpoint/deployment where applicable).
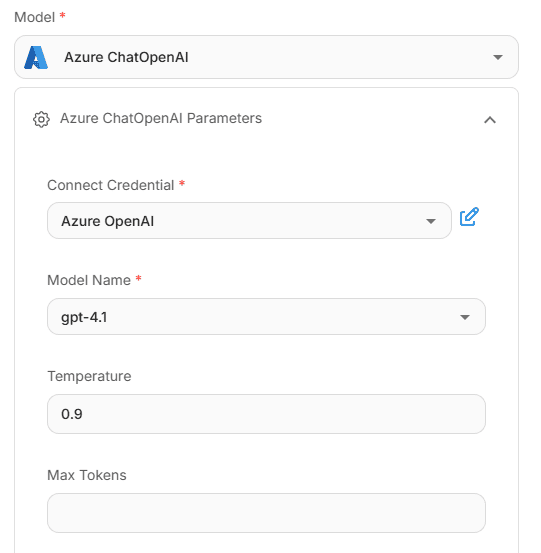
LLM configuration of Intent Identification Agent node
Agent node: data exploration agent
Reports what data is available (e.g., databases/tables, key columns, grain, joins, and freshness) and can return small, PII-safe previews using Teradata MCP tools against Vantage.
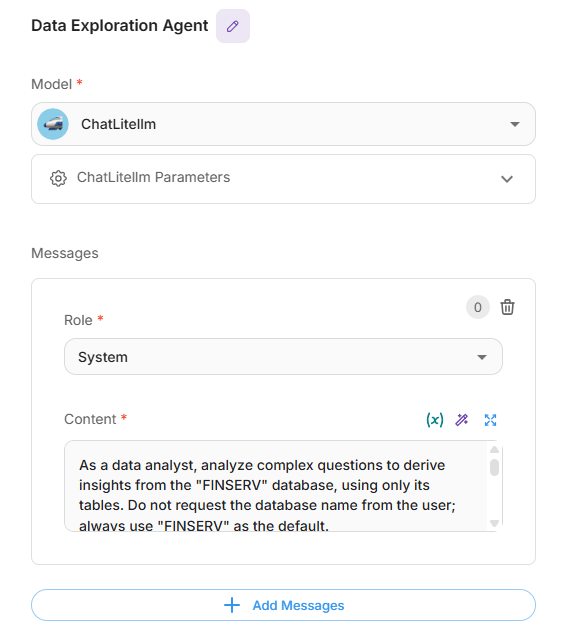
Data Exploration Agent node configuration
The LLM used here is Anthropic Claude Sonnet 4; it can be configured the same way as GPT-4.1. All access to LLMs is provided through a cloud service provider. The specific models available, along with credentials and base URLs, depend on the deployment of Teradata and AgentBuilder.
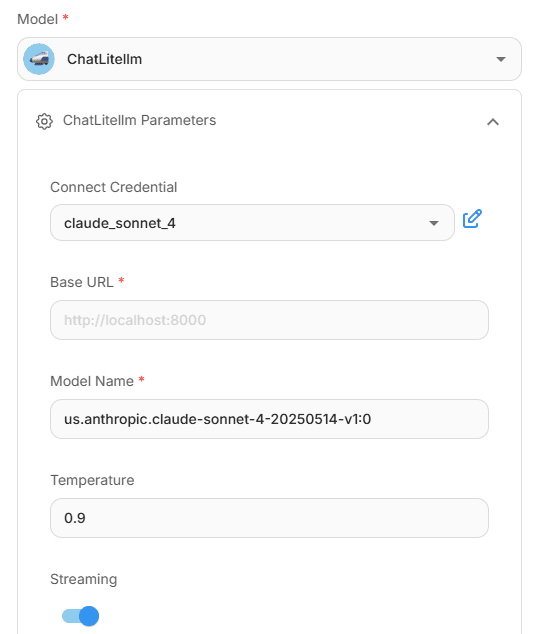
LLM configuration of Data Exploration Agent node
Access to the Teradata MCP server is configured through the “Tool” panel. As with LLM integration, the connection URL and credentials depend on the specific deployment of Teradata and AgentBuilder.
Providing the right tools via Teradata MCP is critical for accurate LLM outputs. Select and scope these tools in the “Available Actions” panel so each agent can call exactly what it needs for governed, reliable results.
Tools can only be selected under Available Actions once MCP server is configured.
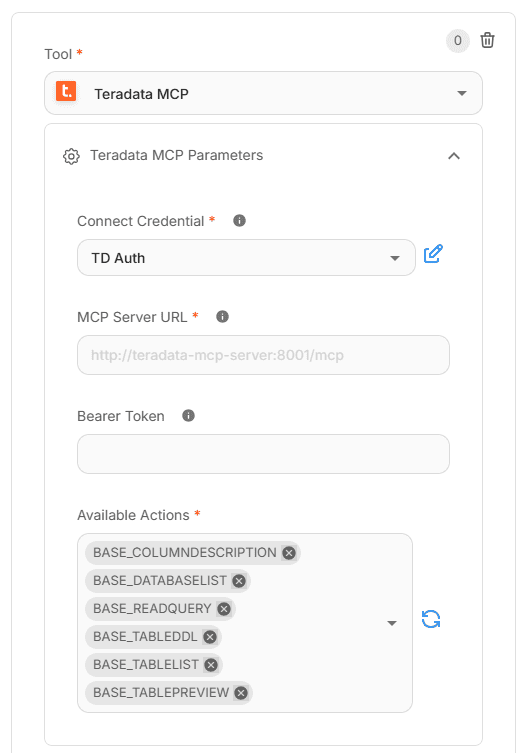
MCP configuration of Data Exploration Agent node
Agent node: insight generator agent
Interprets the question and derives findings only from the governed data, following a reasoning-first workflow: quick data checks (columns, types, missingness), method selection (aggregations, correlations, simple tests), and a brief rationale. It performs the calculation, not just a description, and explains the process before stating results.
For simple scalar asks, it stays concise; for richer questions, it returns a compact business summary. Output is markdown with “Reasoning” and “Conclusion” sections for clarity and reuse.
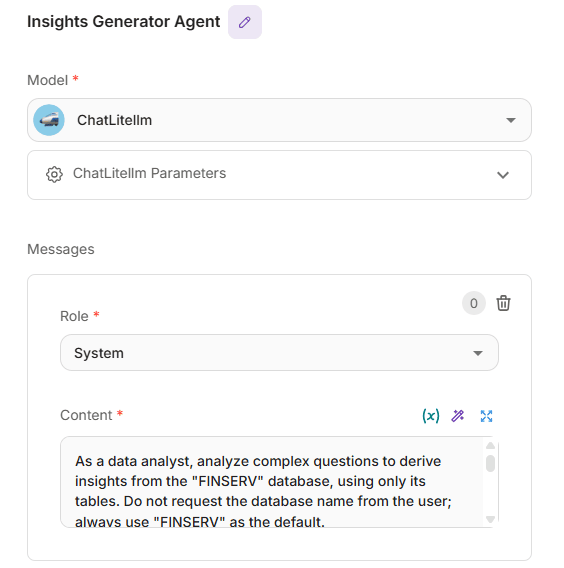
Insight Generator Agent node configuration
The LLM and MCP configurations mirror the Data Exploration Agents configuration, with the addition of Sentiment Extractor in Available Actions when needed.

MCP tools configuration of Insight Generator Agent node
Agent node: strategic reasoning agent
Converts analytical findings into actionable churn-reduction strategies by reviewing feature importance, explaining how key factors drive attrition, and prioritizing where to intervene. It proposes evidence-based methods (e.g., onboarding improvements, complaint triage, targeted cross-sell) and links each recommendation to the contributing drivers with clear rationale and guardrails. Responses are concise and structured in markdown with an intro, numbered reasoning steps, recommended methods to reduce banking churn, and a brief summary of the highest-impact actions.
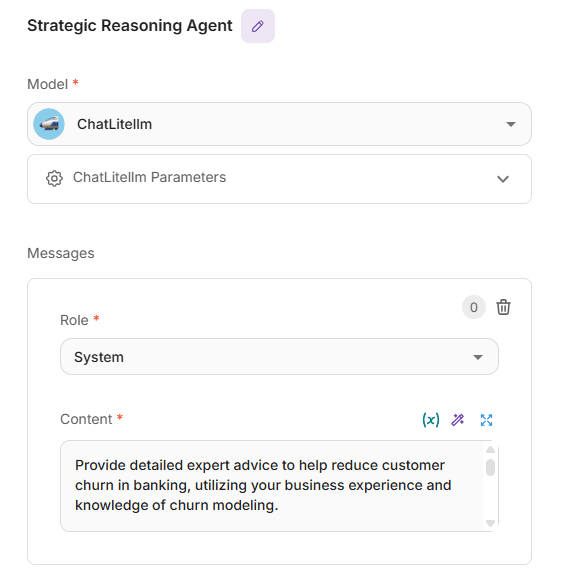
Strategic Reasoning Agent node configuration
The MCP and LLM configuration remains the same, with only changes in MCPs Available Actions.
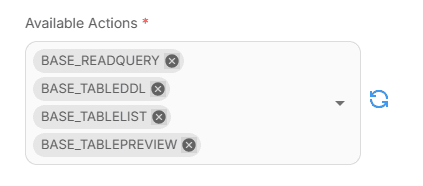
MCP tool configuration of Strategic Reasoning Agent node
Condition agent: check if chart required
Decides whether the answer needs a visualization or should remain textual. It inspects the prompt and, only when the user asks to plot, selects a chart type from Line, Polar, Pie, or Radar; single-value outputs (e.g., corr: 0.89) skip charts. If a valid chart is warranted, it passes a clean spec to the Visualization Agent and Custom Function to render, otherwise it defaults to a table or plain response and routes directly to the “Generate Response” LLM node.
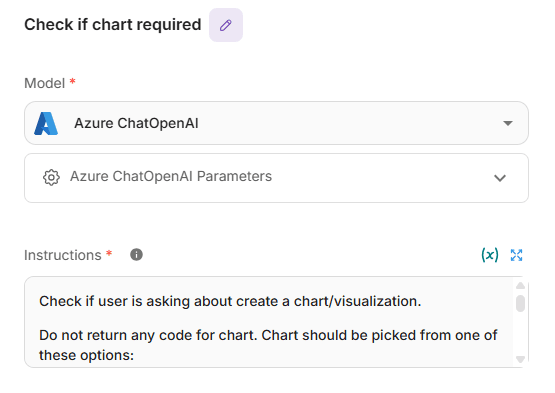
Check if chart required node configuration
The LLM configuration mirrors the earlier condition agent, this node takes the question as input and chooses between two scenarios - chart-related or general. If chart required is selected, it triggers the Visualization Agent to plot a graph, otherwise, it returns a straightforward textual output.
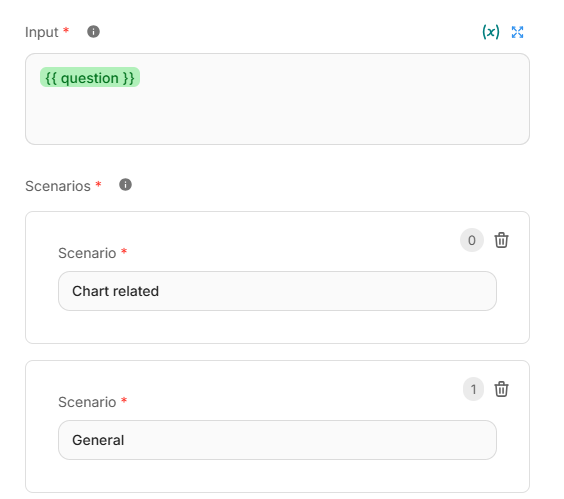
Input and Scenarios detail of Check if chart required node
LLM node: generate response
Composes the final, business-ready answer using the context passed from upstream agents, focusing on clear reasoning and actionable guidance (no code). It identifies the domain of the ask (visualization, tables, churn reduction, database design), applies best-practice logic, and balances detail with brevity for simple scalar questions. The output is 2–4 tight paragraphs that explain the “why,” list concrete next steps, note caveats, and tie recommendations to measurable impact.
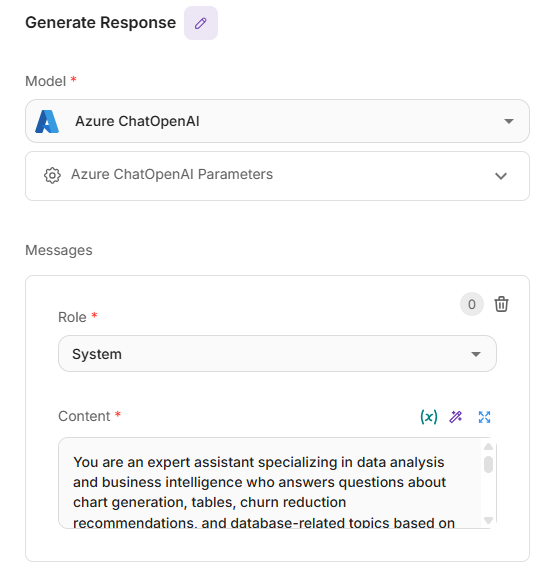
Generate Response node configuration
For clean presentation, Return Response As is set to Assistant Message.

Selection of Assistant message in Generate Response node
Agent node: visualization agent
Emits a strict JSON payload—no prose, notes, or code. If unsure about columns, it first verifies with MCP tools before invoking any chart tools. When a chart is needed, it returns only this structure:
{ "type": "<line|polar|pie|radar>", "title": "<chart title>", "labels": […], "datasets": […] }
If a chart isn’t appropriate, it returns JSON for a simple table instead, without adding or removing fields or including extra text.
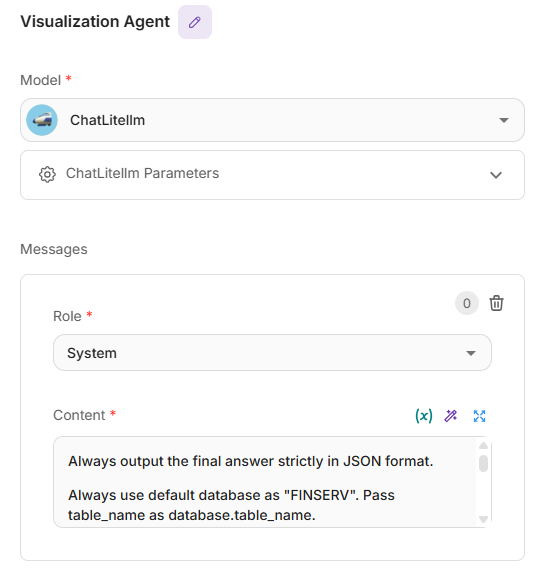
Visualization Agent node configuration
Teradata MCP Available Actions include Teradata plotting tools that help generate the requested visual.
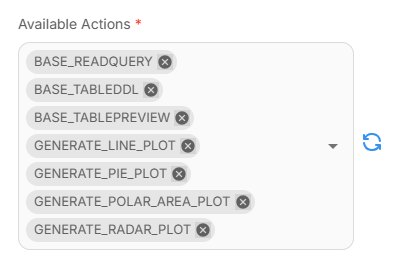
MCP tool configuration of Visualization Agent node
It can generate four chart types:
- Line — trends over time (e.g., weekly churn rate by segment)
- Polar — circular comparison of magnitudes (e.g., complaints by category)
- Pie — part-of-whole (e.g., share of customers by risk tier)
- Radar — multi-metric profile (e.g., cohort scores across engagement, spend, friction)
Custom function: draw function
The Draw Function turns the Visualization Agent’s JSON into a live chart. It expects a clean payload with type, title, labels, and datasets; if that structure is present, it renders an embedded Chart.js graphic in an iframe. If the input isn’t valid chart data (or the task doesn’t require a chart), it gracefully falls back to a plain message instead of breaking the flow. Supported chart types match the gating node: line, polar, pie, and radar.
To wire it in the flow, pass the Visualization Agent’s output to the function as “input_data = {{$flow.state.main_vis_op}}”. The function parses that value, validates that labels and datasets are arrays, and then builds the chart with the provided title. If validation fails, the function simply returns the text it received (e.g., “No chart needed”), keeping responses clean and predictable.
This approach keeps rendering logic outside the agents, avoids code in the final answer, and ensures visuals appear only when they add clarity, everything else stays fast, lightweight, and easy to audit.
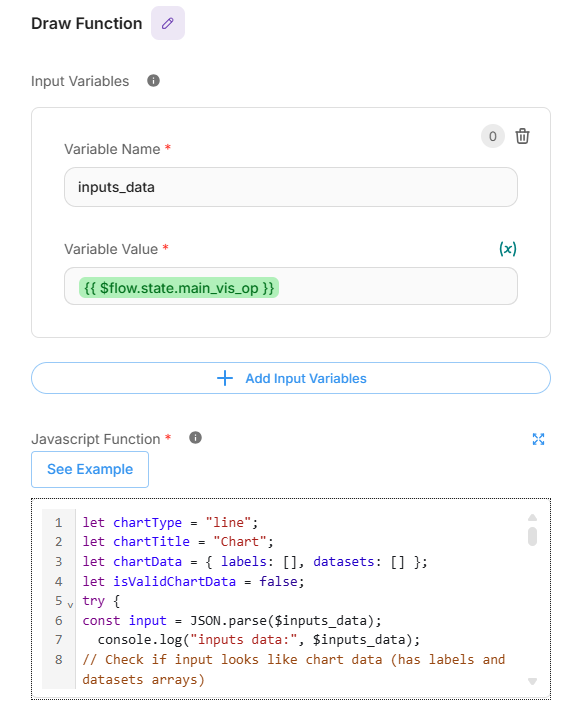
Draw Function node configuration
Output
The CLV multi-agent system tailors each response to the question – returning plain, business-ready text when a single number suffices (e.g., “What is the average CLV?” → $412.37), and a chart when it adds clarity. Two quick examples from the demo:
- Text only ask: “What is the average value of CLV”
- Flow: Start → Intent Identification Agent → Insights Generator Agent → Generate Response
The assistant computes the mean CLV in-database and returns a concise explanation (no visualization).
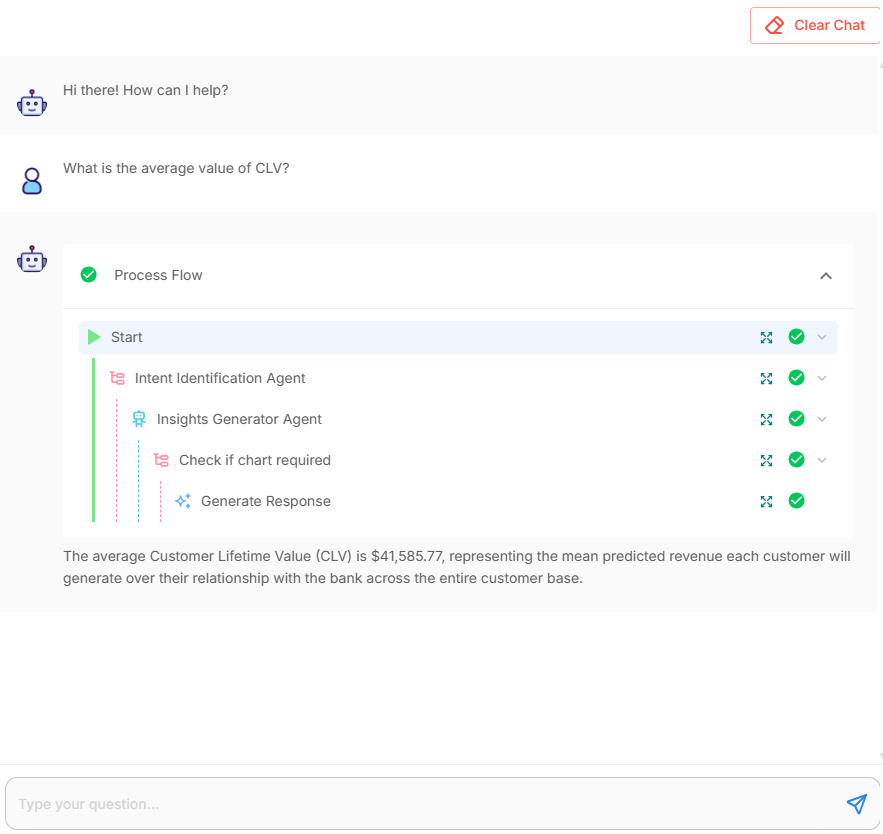
Response and process flow details of “What is the average value of CLV” question
- Visualization ask: “Create a visualization for average value of balance and CLV”
- Flow: Start → Intent Identification Agent → Insights Generator Agent → Check if chart required → Visualization Agent → Draw Function
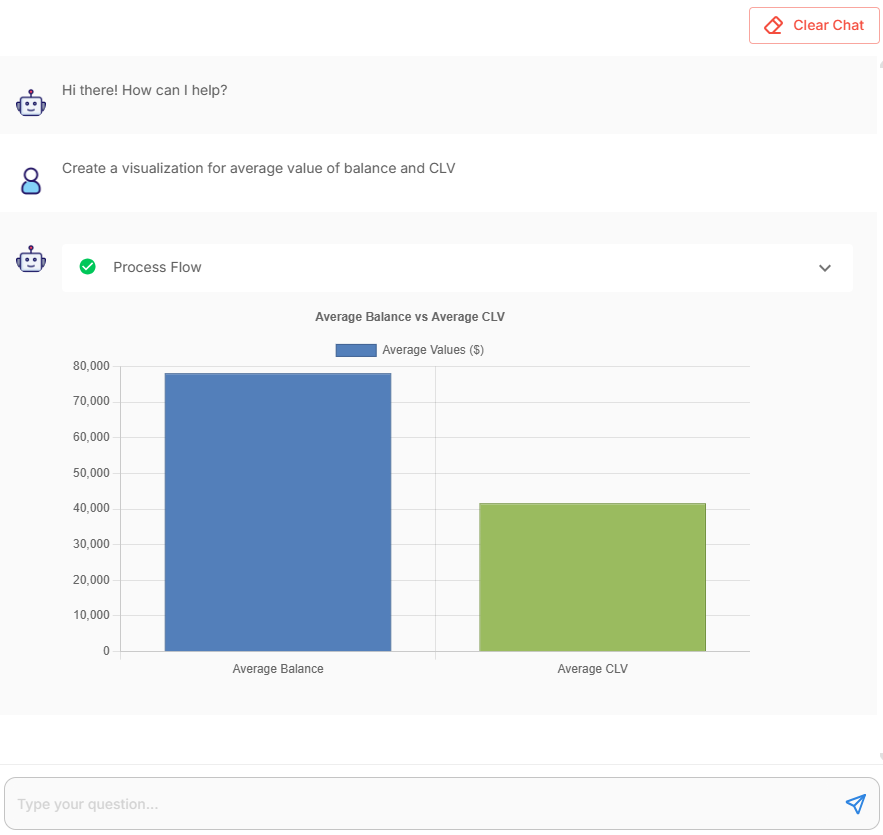
Response details of “Create a visualization for average value of balance and CLV” question
The chart gate detects a plotting request, the Visualization Agent emits a JSON spec, and the Draw Function renders a bar chart.
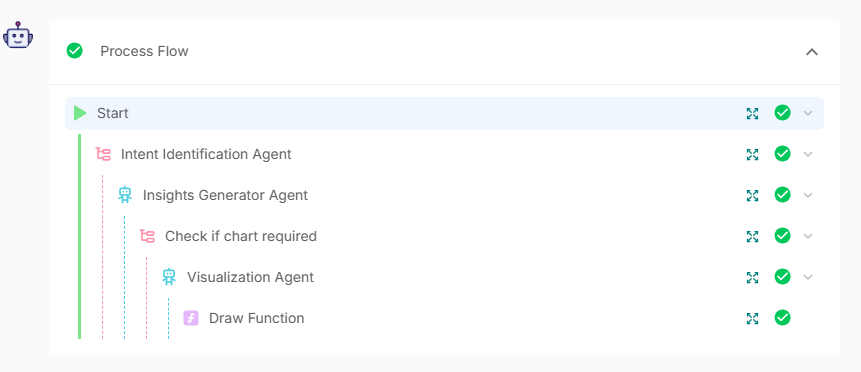
Process flow details of “Create a visualization for average value of balance and CLV” question
Every response is traceable, the process flow shows which nodes executed, and the output links back to the data and policies used. Visuals appear only when requested or clearly helpful, otherwise, the answer stays fast, readable, and ready to act on.
Conclusion
Teradata’s Customer Intelligence Framework closes the loop from data → signal → activation. Data remains governed in Vantage; signals are detected and interpreted in real time; and activation happens through guard-railed next-best actions that are explainable and measurable. Built in AgentBuilder, the CLV demo shows autonomous customer intelligence in practice: agents understand intent, assemble evidence, and trigger the right response - text for simple answers, visuals when they add clarity, and recommendations when action is warranted.
The pattern extends beyond customer lifetime value to use cases such as churn reduction, cross-sell optimization, and service issue deflection, without redesigning the underlying architecture. Performance comes from keeping computation in Teradata Vantage; auditability comes from end-to-end traces of signals, decisions, and actions; and delivery speed comes from reusable prompts, tools, and node templates assembled in AgentBuilder.
Ready to turn signals into outcomes?